I just returned from Google Next '17. It was my first time at Next, or at a Google event. I had already been looking at Google services for both professional and personal work, and the agenda promised some answers to questions I had, and probably more questions that I'd need to answer.
Some of the reactions to Google Next are interesting. This one was disappointed in the focus on enterprise customers, wanting more visionary focus and less SAP :) I get the sentiment, but the reality I live in is the one that Google wants to transform.
The one thing I came away with from Next '17 is that there is a viable on-ramp for teams to move faster by delegating a lot of the undifferentiated heavy lifting they do on premise today to managed services in the cloud. That's because of what those services are and how they are implemented. Those services are what is pulling teams to public cloud.
Managed services have always been one of the core values of public cloud, along with general purpose IaaS. In the past few years, and especially in the past year, the service diversity and capability all three major public cloud providers has made managed services the overwhelming core value of public cloud for most companies. IaaS is becoming more and more of an implementation detail.
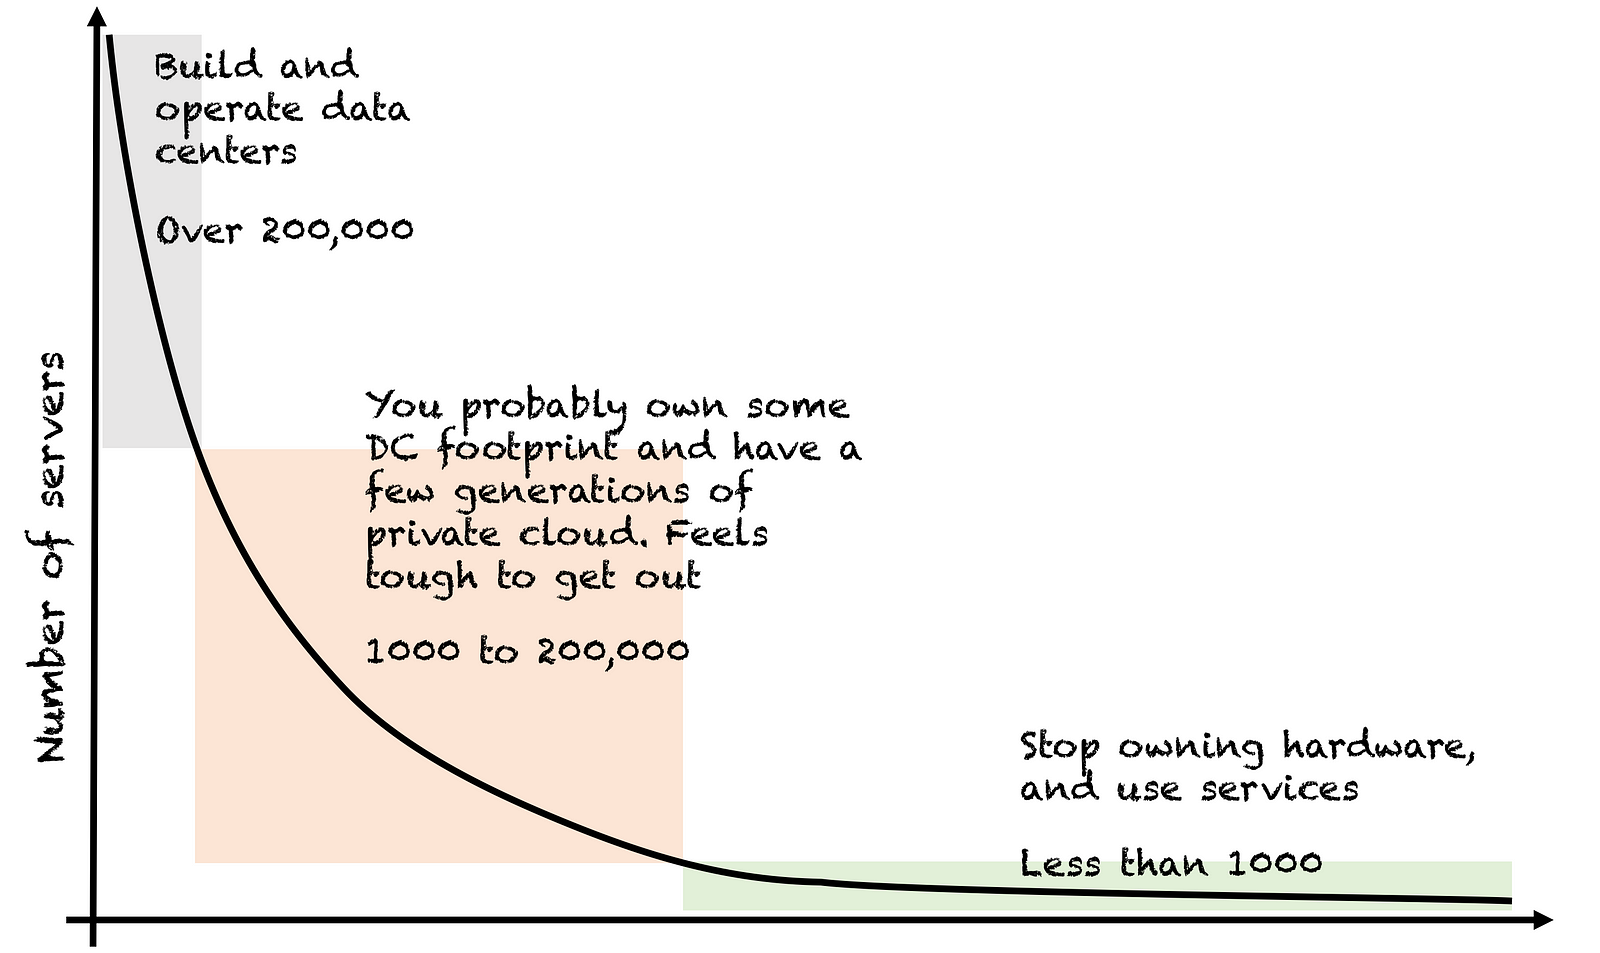
The graph below from this post by Subbu Allamaraju explains where the value of public cloud is for most companies. Most companies have less than 1000 servers, and would benefit from the increased market share of getting product to customers faster before they benefit from any economy of scale. That's true regardless of which public cloud services you consume. They're managed for you, so you get to focus on building your product more, and spend less time operating that product.
Services are great, but not if they lock you into a single cloud. Ideally, a team uses services that exist on another cloud provider or are open source, so at worst I could just run them on another providers IaaS. If a service is proprietary, it needs to provide more value than a non proprietary version would.
So services are awesome, except when they're proprietary. Sort of. I have grouped Google offerings into three sections: Open - based on OSS, Proprietary - not OSS but still attractive, and Future State. I will try to explain the value proposition I see in each one. This is not the entire list of services, but the ones that really fit the problems I've been running into lately.
Google Container Engine (GKE), based on Kubernetes, GKE GA'd in August 2015, and momentum really started to pick up in 2016. Kubernetes has caught and passed Cloud Foundry as the default OSS way to think about running apps both on prem and across all public clouds. Microsoft offers managed Kubernetes, and many teams run their own cluster on AWS.
One reason for the shift in momentum is that it is much easier to move legacy architectures to Kubernetes than it is to move them to Cloud Foundry. While Cloud Foundry is now working with containers, it doesn't work with state - state is assumed to be outside of the cluster. This makes migrating any typical architecture over more involved.
At a minimum, moving an app to run on Cloud Foundry would require it to be refactored to use a service broker for connections to stateful backend services. In contrast, moving a legacy application to Kubernetes would require a config change to point to the service endpoint of the stateful service.
I'm not saying it's completely plug and play -- the stateful service needs to be configured to meet required replication policies, and leverage persistent volumes -- but the hardcore 12factor requirements around statelessness are not present in Kubernetes. Because of this, migration to 12factor microservices can become much more incremental, which increases the chance of migration success.
Kubernetes, like clustered anything, is hard to configure and operate. The discussion on Kubernetes networking I attended on the last day of Next 17 reinforced that there is significant complexity that make running Kubernetes on premise much harder than using a managed service. I'm very excited to start experimenting with Kubernetes via Google Container Engine because I don't want to trip over that complexity.
I'm also excited to play with Minikube as part of a rational Kubernetes dev stack. Minikube is a great step forward for kubernetes developer tooling, and I think it's going to massively accelerate adoption. I think it's greatly simplified how to develop more complex Kubernetes apps that have multiple services. Developers can accurately replicate cluster state and service access patterns with minikube, and push changes to a deploy pipeline with more confidence.
DataFlow (based on Apache Beam) is exciting to me because of the unified processing model around batch and streaming. Prior to Beam, cognitive overhead for the number of options for both batch and streaming was overwhelming. Being able to reason across a single system, even if that system uses different underlying processing technologies, makes it possible for teams to provide value faster because they don't have to ramp up on very diverse APIs and concepts. We can provide the same insights regardless of delivery mode
Despite what I said about not being locked into a single cloud, there are Google specific technologies that make me consider making exceptions to the rule. All of these are in the data processing/machine learning realm. Google IMO is far ahead of the other providers wrt getting intelligence from data. In this case I think the lock in is worth it due to the significant leverage gained.
The scale potential of Spanner is very exciting. The implementation is not a silver bullet - it forces you to reason about locality of data at the schema level - but in my opinion this is much better than the locality ignorant schemas of traditional RDBMS system that force people to horizontally partition and therefore silo data in response to scale.
BigTable is very appealing because of its natural fit to time series data. A lot of the data I play with is event based, and so most insights come from aggregating events . The kinds of in stream insights done in DataFlow would be greatly expanded if it can access state in BigTable.
The ability to make queries over BigTable with BigQuery is also really exciting. I had previously thought of BigQuery as a way to reason over object storage alone, but the ability to unify how to reason across multiple sources of data is simplifying, much in the same way that reasoning over batch vs stream processing is simplifying.
At this point it would be logical to ask if the services I'm most excited about exist on other public clouds. Lock in needs to be weighed against immediate value. Microsoft does offer Kubernetes as an option in it's Container Service, along with Mesos DC/OS and Docker Swarm. Apache Beam can be run on other IaaS and is in fact being built to use Spark as a runner.
Spanner, BigTable, and BigQuery are unique to Google, but the patterns (RDBMS, Columnar Storage, batch SQL across heterogenous data sources) have OSS analogues. I don't feel as locked in as if I were building services at Amazon, using their purely proprietary services. But I am more locked in on the data processing side because Google is ahead of the scaled data processing curve when compared to the other public cloud vendors.
Beyond processing and storing data at scale, these services are the most exciting to me because they have the potential to democratize machine learning the way public cloud originally democratized self service compute, storage, and network. One is based on open source, the other is proprietary, both are examples of how Google operates from a future state.
Google Machine Learning Engine (Tensorflow) is intriguing. When I wrote a neural network as part of a class, I spent so much time struggling with setting it up that I lost perspective on the problem we were solving. Anything that purports to help me keep this perspective by making neural net construction (and the tuning associated with backpropagation) easier is something that gets me excited.
The Vision API - I'm assuming this is (partially) based on Tensorflow, because of the limited image recognition work I've done in the past. Just playing around with the API gives me about 20 new ideas I'd like to work into current personal projects. Now I just need a time management API...
I'm hoping to get some time to play with a lot of these in the next few weeks, and document my (mis) adventures here. It's been fun reading about the tech and doing 'hello world' applications, but I'd like to apply them to my current problem domain and see how far I get by leveraging them.
Some of the reactions to Google Next are interesting. This one was disappointed in the focus on enterprise customers, wanting more visionary focus and less SAP :) I get the sentiment, but the reality I live in is the one that Google wants to transform.
The one thing I came away with from Next '17 is that there is a viable on-ramp for teams to move faster by delegating a lot of the undifferentiated heavy lifting they do on premise today to managed services in the cloud. That's because of what those services are and how they are implemented. Those services are what is pulling teams to public cloud.
Managed services have always been one of the core values of public cloud, along with general purpose IaaS. In the past few years, and especially in the past year, the service diversity and capability all three major public cloud providers has made managed services the overwhelming core value of public cloud for most companies. IaaS is becoming more and more of an implementation detail.
The graph below from this post by Subbu Allamaraju explains where the value of public cloud is for most companies. Most companies have less than 1000 servers, and would benefit from the increased market share of getting product to customers faster before they benefit from any economy of scale. That's true regardless of which public cloud services you consume. They're managed for you, so you get to focus on building your product more, and spend less time operating that product.
Services are great, but not if they lock you into a single cloud. Ideally, a team uses services that exist on another cloud provider or are open source, so at worst I could just run them on another providers IaaS. If a service is proprietary, it needs to provide more value than a non proprietary version would.
So services are awesome, except when they're proprietary. Sort of. I have grouped Google offerings into three sections: Open - based on OSS, Proprietary - not OSS but still attractive, and Future State. I will try to explain the value proposition I see in each one. This is not the entire list of services, but the ones that really fit the problems I've been running into lately.
Open
Google Container Engine (GKE), based on Kubernetes, GKE GA'd in August 2015, and momentum really started to pick up in 2016. Kubernetes has caught and passed Cloud Foundry as the default OSS way to think about running apps both on prem and across all public clouds. Microsoft offers managed Kubernetes, and many teams run their own cluster on AWS.
One reason for the shift in momentum is that it is much easier to move legacy architectures to Kubernetes than it is to move them to Cloud Foundry. While Cloud Foundry is now working with containers, it doesn't work with state - state is assumed to be outside of the cluster. This makes migrating any typical architecture over more involved.
At a minimum, moving an app to run on Cloud Foundry would require it to be refactored to use a service broker for connections to stateful backend services. In contrast, moving a legacy application to Kubernetes would require a config change to point to the service endpoint of the stateful service.
I'm not saying it's completely plug and play -- the stateful service needs to be configured to meet required replication policies, and leverage persistent volumes -- but the hardcore 12factor requirements around statelessness are not present in Kubernetes. Because of this, migration to 12factor microservices can become much more incremental, which increases the chance of migration success.
Kubernetes, like clustered anything, is hard to configure and operate. The discussion on Kubernetes networking I attended on the last day of Next 17 reinforced that there is significant complexity that make running Kubernetes on premise much harder than using a managed service. I'm very excited to start experimenting with Kubernetes via Google Container Engine because I don't want to trip over that complexity.
I'm also excited to play with Minikube as part of a rational Kubernetes dev stack. Minikube is a great step forward for kubernetes developer tooling, and I think it's going to massively accelerate adoption. I think it's greatly simplified how to develop more complex Kubernetes apps that have multiple services. Developers can accurately replicate cluster state and service access patterns with minikube, and push changes to a deploy pipeline with more confidence.
DataFlow (based on Apache Beam) is exciting to me because of the unified processing model around batch and streaming. Prior to Beam, cognitive overhead for the number of options for both batch and streaming was overwhelming. Being able to reason across a single system, even if that system uses different underlying processing technologies, makes it possible for teams to provide value faster because they don't have to ramp up on very diverse APIs and concepts. We can provide the same insights regardless of delivery mode
Proprietary
Despite what I said about not being locked into a single cloud, there are Google specific technologies that make me consider making exceptions to the rule. All of these are in the data processing/machine learning realm. Google IMO is far ahead of the other providers wrt getting intelligence from data. In this case I think the lock in is worth it due to the significant leverage gained.
The scale potential of Spanner is very exciting. The implementation is not a silver bullet - it forces you to reason about locality of data at the schema level - but in my opinion this is much better than the locality ignorant schemas of traditional RDBMS system that force people to horizontally partition and therefore silo data in response to scale.
BigTable is very appealing because of its natural fit to time series data. A lot of the data I play with is event based, and so most insights come from aggregating events . The kinds of in stream insights done in DataFlow would be greatly expanded if it can access state in BigTable.
The ability to make queries over BigTable with BigQuery is also really exciting. I had previously thought of BigQuery as a way to reason over object storage alone, but the ability to unify how to reason across multiple sources of data is simplifying, much in the same way that reasoning over batch vs stream processing is simplifying.
At this point it would be logical to ask if the services I'm most excited about exist on other public clouds. Lock in needs to be weighed against immediate value. Microsoft does offer Kubernetes as an option in it's Container Service, along with Mesos DC/OS and Docker Swarm. Apache Beam can be run on other IaaS and is in fact being built to use Spark as a runner.
Spanner, BigTable, and BigQuery are unique to Google, but the patterns (RDBMS, Columnar Storage, batch SQL across heterogenous data sources) have OSS analogues. I don't feel as locked in as if I were building services at Amazon, using their purely proprietary services. But I am more locked in on the data processing side because Google is ahead of the scaled data processing curve when compared to the other public cloud vendors.
Future State
Beyond processing and storing data at scale, these services are the most exciting to me because they have the potential to democratize machine learning the way public cloud originally democratized self service compute, storage, and network. One is based on open source, the other is proprietary, both are examples of how Google operates from a future state.
Google Machine Learning Engine (Tensorflow) is intriguing. When I wrote a neural network as part of a class, I spent so much time struggling with setting it up that I lost perspective on the problem we were solving. Anything that purports to help me keep this perspective by making neural net construction (and the tuning associated with backpropagation) easier is something that gets me excited.
The Vision API - I'm assuming this is (partially) based on Tensorflow, because of the limited image recognition work I've done in the past. Just playing around with the API gives me about 20 new ideas I'd like to work into current personal projects. Now I just need a time management API...
I'm hoping to get some time to play with a lot of these in the next few weeks, and document my (mis) adventures here. It's been fun reading about the tech and doing 'hello world' applications, but I'd like to apply them to my current problem domain and see how far I get by leveraging them.

